There is almost no dispute among investors: If you want to dampen large price fluctuations and avoid sharp falls in the value of your equity portfolio, you should add bonds to the mix. Their prices are far less volatile than those of shares. Moreover, they often bring positive returns precisely when share prices are falling. Unfortunately, the latter cannot always be relied upon. On the contrary: as the example of US government bonds shows, strong countervailing behaviour has tended to be the exception over the past 140 years.
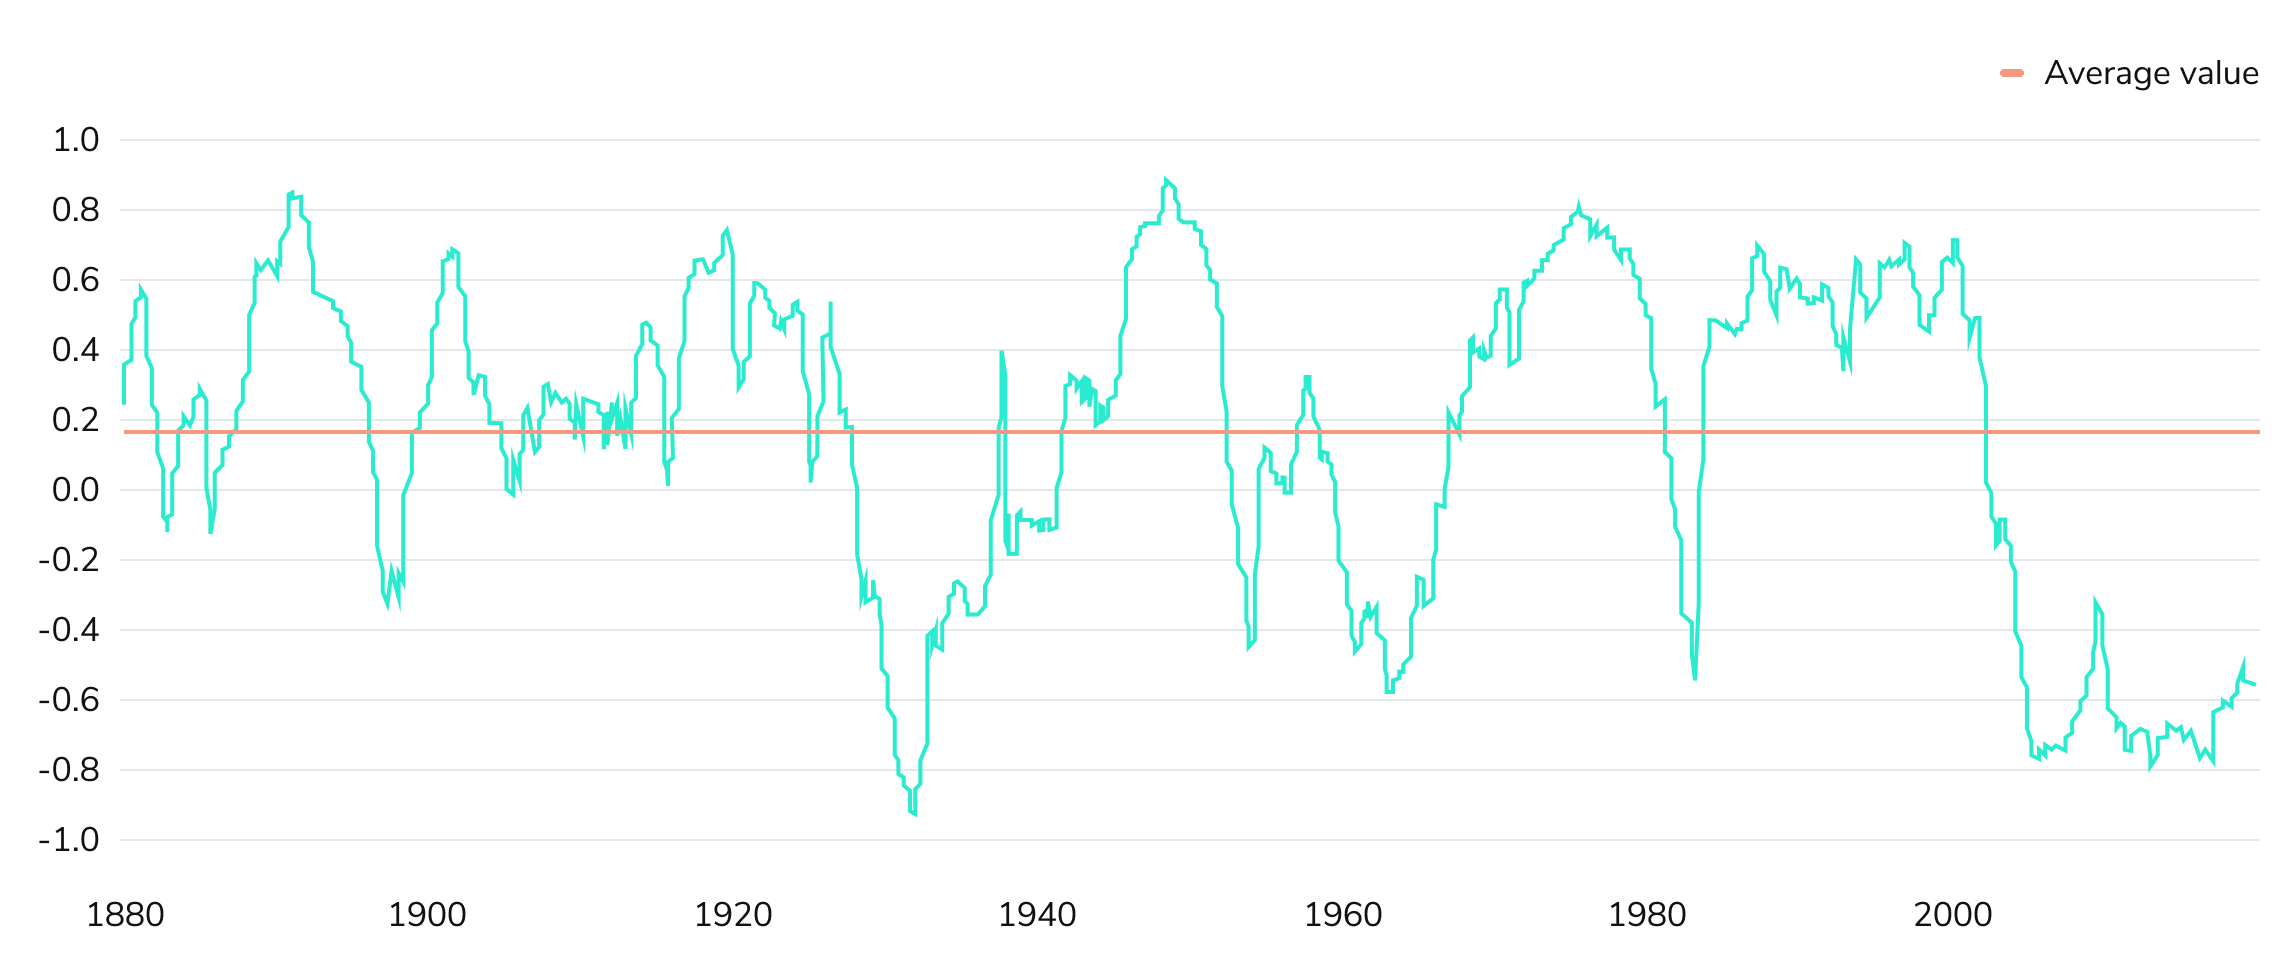
This is clearly illustrated by the correlation between the performance of the US equity index S&P 500 and the yields of US government bonds. If the correlation is low, i.e. its value is negative, the returns of both asset classes tend to move in opposite directions: rising share prices means falling bond prices and vice versa. The lowest possible correlation between the two asset classes is what investors want. In such a scenario, government bonds are an excellent means for diversification. This has been the norm for years but the negative correlation is by no means set in stone.
Diversification effect weaker than often claimed
Correlation between US equities (S&P 500) and US government bonds (10-year yield, derived from average yields of different bonds with different maturities) since the end of the 19th century

Monthly values for overlapping five-year periods. Source: CMO, Robert Shiller
On the contrary, correlation was at historically low levels for almost ten years until very recently. Over the last 140 years correlation has averaged around 0.2, as shown in our chart, which is based on a presentation by the US investment firm GMO. A correlation value of zero would mean that stock and bond returns develop quasi-independently of each other, -1 a perfectly inverse relationship. The slightly positive average value indicates that on average there is a small positive correlation. A stock-bond portfolio does achieve some diversification effects in the long term, however, these are not as reliable as many might think. Only in very short periods did the correlation actually amount to 0.2. For the most part it was far from that. At times, the two asset classes were even almost in sync, most notably in the early 1940s.
What conclusion should investors draw from the findings? They cannot rely on risk diversification through the combination of equities and bonds to work reliably in every period. In times when the two asset classes are more correlated, bonds cushion price fluctuations in the stock market less or not at all. This increases the volatility in a portfolio consisting of shares and bonds. Anyone who assumes that an investment consisting of half equities and half bonds is automatically a balanced investment is lulling themselves into a false sense of security.
In order to keep risks within bounds, an investor would also have to constantly keep an eye on the correlations between the performance of different asset classes and adjust their portfolio accordingly. This requires discipline, time and know-how - or the right partner. At Scalable Capital, dynamic risk management monitors correlations between asset classes, among many other parameters. If the algorithm detects that changes in the correlations threaten a sustainable risk shift in the portfolio, it rebalances: depending on the overall situation, it increases the quota of low-risk investments, for example, or diversifies more broadly by increasing the shares in real estate and commodities, for example. All this happens without the investor having to worry about it.
Image: Simon, pixabay.com
Risk Disclaimer – There are risks associated with investing. The value of your investment may fall or rise. Losses of the capital invested may occur. Past performance, simulations or forecasts are not a reliable indicator of future performance. We do not provide investment, legal and/or tax advice. Should this website contain information on the capital market, financial instruments and/or other topics relevant to investment, this information is intended solely as a general explanation of the investment services provided by companies in our group. Please also read our risk information and terms of use.
